
Behavioral Fingerprints Across OpenAI Models
Response Intensity, Cross-Inventory Structure, Variant Splits, and the Limits of Forecasting
Across 17 stateless runs and 16 OpenAI model identifiers, continuous psychometric inventories recovered a shared behavioral geometry that was more stable than model-family or categorical type labels. Big Five and Dark Triad distances remained correlated after endpoint adjustment, bootstrap archetypes linked models across version families, direct and derived MBTI types agreed in only one of 16 runs, and rolling forecasts succeeded only late in the observed sequence.
Behavioral Fingerprints Across OpenAI Models
Response Intensity, Cross-Inventory Structure, Variant Splits, and the Limits of Forecasting
Gordon Olson
AI Psychometrics Lab
Contact: gordon@sonofol.org
Abstract
Psychometric inventories can expose reproducible response signatures in large language models, but the most useful outcome may be behavioral fingerprinting rather than personality attribution. We analyzed every OpenAI-labeled run available in the AI Psychometrics Lab database on July 17, 2026: 17 stateless runs spanning 16 model identifiers, with two independent runs for GPT-5.2. The analysis combines uncalibrated IPIP-NEO-120 domains and facets, item-level consistency, endpoint use, Dark Triad and DISC geometry, direct and derived MBTI labels, principal components, distance-based family tests, bootstrap archetypes, and rolling forecast evaluation.
The raw Big Five landscape is highly structured. A leading component explained 68.8% of five-domain variation and placed o3-mini, GPT-5.4, GPT-5.6 Sol, GPT-5.5, and GPT-5.6 Terra at one end, with GPT-4o and GPT-3.5 Turbo Instruct at the other. Yet 87.3% of that component was associated with endpoint-response share. More importantly, continuous inventories recovered overlapping model geometry: Big Five and Dark Triad distance matrices correlated at rho = 0.523 and remained correlated after endpoint adjustment (rho = 0.478), while Big Five and DISC convergence fell from rho = 0.403 to 0.100 after adjustment. Continuous profiles therefore contain both a shared behavioral signal and a route-specific response-intensity component.
The signatures were not arbitrary, but family names were weak summaries. The two GPT-5.2 runs retrieved one another as nearest neighbors; however, same-lineage pairs were no closer than between-lineage pairs overall, and only one of 13 identifiers from multi-model lineages had a same-lineage nearest neighbor. Bootstrap archetypes instead linked GPT-5.4 with o3-mini and GPT-5.6 Sol, GPT-5.5 with GPT-5.6 Terra, and GPT-4 with GPT-5.6 Luna. Direct and Big-Five-derived MBTI types agreed exactly in only one of 16 comparable runs. A version trend predicted GPT-5.5 and GPT-5.6 Terra, persistence predicted GPT-5.6 Sol, and GPT-5.6 Luna remained a break, but rolling tests show that the trend failed earlier in the sequence. These results support behavioral fingerprints, archetype-aware monitoring, and anomaly detection. The current sample is too small to support calibrated probabilities for unseen models.
Model evaluation usually asks whether a system is more accurate, safer, faster, or cheaper. Personality inventories ask a different question: what pattern of choices does the system repeatedly make when prompted to describe itself or choose among behavioral statements? That pattern can be operationally useful even if the model has no human personality, biography, or stable inner subject.
Prior research supports both optimism and caution. Some studies report reliable and distinguishable LLM response profiles under carefully controlled conditions (Huang et al., 2024; Lee et al., 2025; Serapio-Garcia et al., 2023/2025). Other work finds that human-designed inventories may not recover human-like latent structure in models and that alignment can compress several traits into a socially desirable direction (Zierahn et al., 2026). Likert scores are also vulnerable to social-desirability and response-format effects (Salecha et al., 2024; Li et al., 2025).
This study uses the OpenAI slice of the lab database to ask six focused questions:
- Are model identifiers distinguishable in five-domain and 30-facet space?
- Do named model families correspond to actual neighborhoods in behavioral space?
- Does the leading signal reflect trait configuration, endpoint response intensity, or both?
- Do Big Five, Dark Triad, DISC, and MBTI routes recover the same model structure?
- Are the discovered archetypes stable when the five domains are resampled?
- Does a version-based trend beat simple profile persistence in rolling hindcasts?
We use the phrase synthetic response signature rather than personality. It names what was measured without assuming that the same latent construct exists in humans and language models.
2.1 Dataset
The snapshot contains 17 OpenAI-labeled runs representing 16 distinct model identifiers:
- GPT-3.5 Turbo, GPT-3.5 Turbo 16k, and GPT-3.5 Turbo Instruct
- GPT-4 and GPT-4 Turbo
- GPT-4o and GPT-4o Mini
- o3-mini
- GPT-5.2, GPT-5.4, GPT-5.4 Mini, and GPT-5.4 Nano
- GPT-5.5
- GPT-5.6 Sol, GPT-5.6 Luna, and GPT-5.6 Terra
GPT-5.2 is the only repeated identifier, with two runs. All records were stored under the lab's Base Model persona condition; the corresponding configuration records contain an empty system prompt. These labels describe the records in this database and should not be read as independent verification of vendor architecture, training recipe, or release lineage.
The primary instrument is the public-domain 120-item IPIP representation of five domains and 30 facets (Johnson, 2014). Each Big Five item contains repeated administrations, allowing item-level consistency and endpoint-use diagnostics in addition to aggregate trait scoring.
2.2 Scoring and quality control
Cross-model comparisons use the uncalibrated domain totals stored as _raw_O, _raw_C, _raw_E, _raw_A, and _raw_N, each on the observed 24-120 scale. Calibrated scores were retained for audit but excluded from the primary analysis because 21 of 85 run-domain values, or 24.7%, were pinned at the minimum or maximum. Saturation affected 47.1% of conscientiousness values, 41.2% of agreeableness values, and 35.3% of neuroticism values. A bounded calibration can be useful for presentation, but it erases distances among high-scoring models.
For every run we calculated:
- the mean within-item standard deviation across the 120 Big Five items;
- the average modal-response share across items;
- the fraction of all Big Five responses at endpoints 1 or 5;
- model-level means when an identifier had more than one run.
GPT-3.5 Turbo Instruct had the highest within-item variability (mean item SD = 0.742) and the lowest average modal share (0.598). GPT-4 Turbo was the most repetitive under this metric (mean item SD = 0.102; modal share = 0.932).
2.3 Statistical analysis
We standardized the five raw domain totals across 16 model identifiers and performed principal component analysis. We estimated the proportion of each domain's variance associated with named lineage using between-lineage sums of squares divided by total sums of squares.
For the primary era contrast, we compared six legacy chat identifiers (GPT-3.5 Turbo, GPT-3.5 Turbo 16k, GPT-4, GPT-4 Turbo, GPT-4o, GPT-4o Mini) with six frontier-core identifiers (o3-mini, GPT-5.2, GPT-5.4, GPT-5.5, GPT-5.6 Sol, GPT-5.6 Terra). GPT-3.5 Turbo Instruct and the smaller or divergent frontier variants were excluded from this contrast but retained in all-model analyses. Exact two-sided permutation values enumerate all 924 allocations of 12 identifiers into groups of six. They are descriptive because the identifiers are a census of available records, not a random sample from a population.
To test sensitivity to response intensity, each trait was regressed on endpoint-response share across all 16 identifiers. We then repeated the era comparison on standardized residuals. This is a bounding analysis rather than a definitive correction: endpoint use may be a nuisance response style, a genuine part of the model's synthetic signature, or both.
Finally, we evaluated deterministic k-means solutions from two through six clusters using 200 starts and mean silhouette width. A five-cluster solution had the best observed silhouette (0.500), but cluster results remain exploratory at this sample size.
2.4 Cross-inventory and family-structure tests
We compared the geometry recovered by Big Five, Dark Triad, and DISC using standardized Euclidean distance matrices. Mantel Spearman correlations were evaluated with 10,000 model-label permutations. Big Five-Dark Triad and Big Five-DISC comparisons were repeated after regressing every instrument dimension on Big Five endpoint-response share. Direct MBTI labels were compared with labels derived from Big Five scores at the complete four-letter and individual-letter levels.
Family coherence was tested by comparing all 11 same-lineage pair distances with 109 between-lineage distances and permuting lineage labels 10,000 times while preserving group sizes. We also measured same-lineage nearest-neighbor retrieval. To quantify archetype stability, the five Big Five domains were resampled with replacement 2,000 times; a five-cluster solution was refit on every resample and aligned to the full-data archetypes by maximum membership overlap. The resulting proportions are conditional bootstrap stability estimates, not population probabilities.
2.5 Rolling hindcast
For each domain, a linear regression used numeric version labels for GPT-3.5 Turbo, GPT-4, GPT-4o, mean GPT-5.2, and GPT-5.4. It predicted GPT-5.5 and the three GPT-5.6 variants. Error is root mean squared error after standardizing domains by their across-model standard deviations. A persistence baseline repeats the most recent observed profile.
We then repeated the procedure at rolling origins: the first three identifiers predicted GPT-5.2, the first four predicted GPT-5.4, and the first five predicted GPT-5.5 and GPT-5.6. Numeric version labels are not an equal-interval developmental scale, so these tests assess descriptive extrapolation only. They do not establish a calibrated forecasting system.
3.1 The raw OpenAI signature landscape
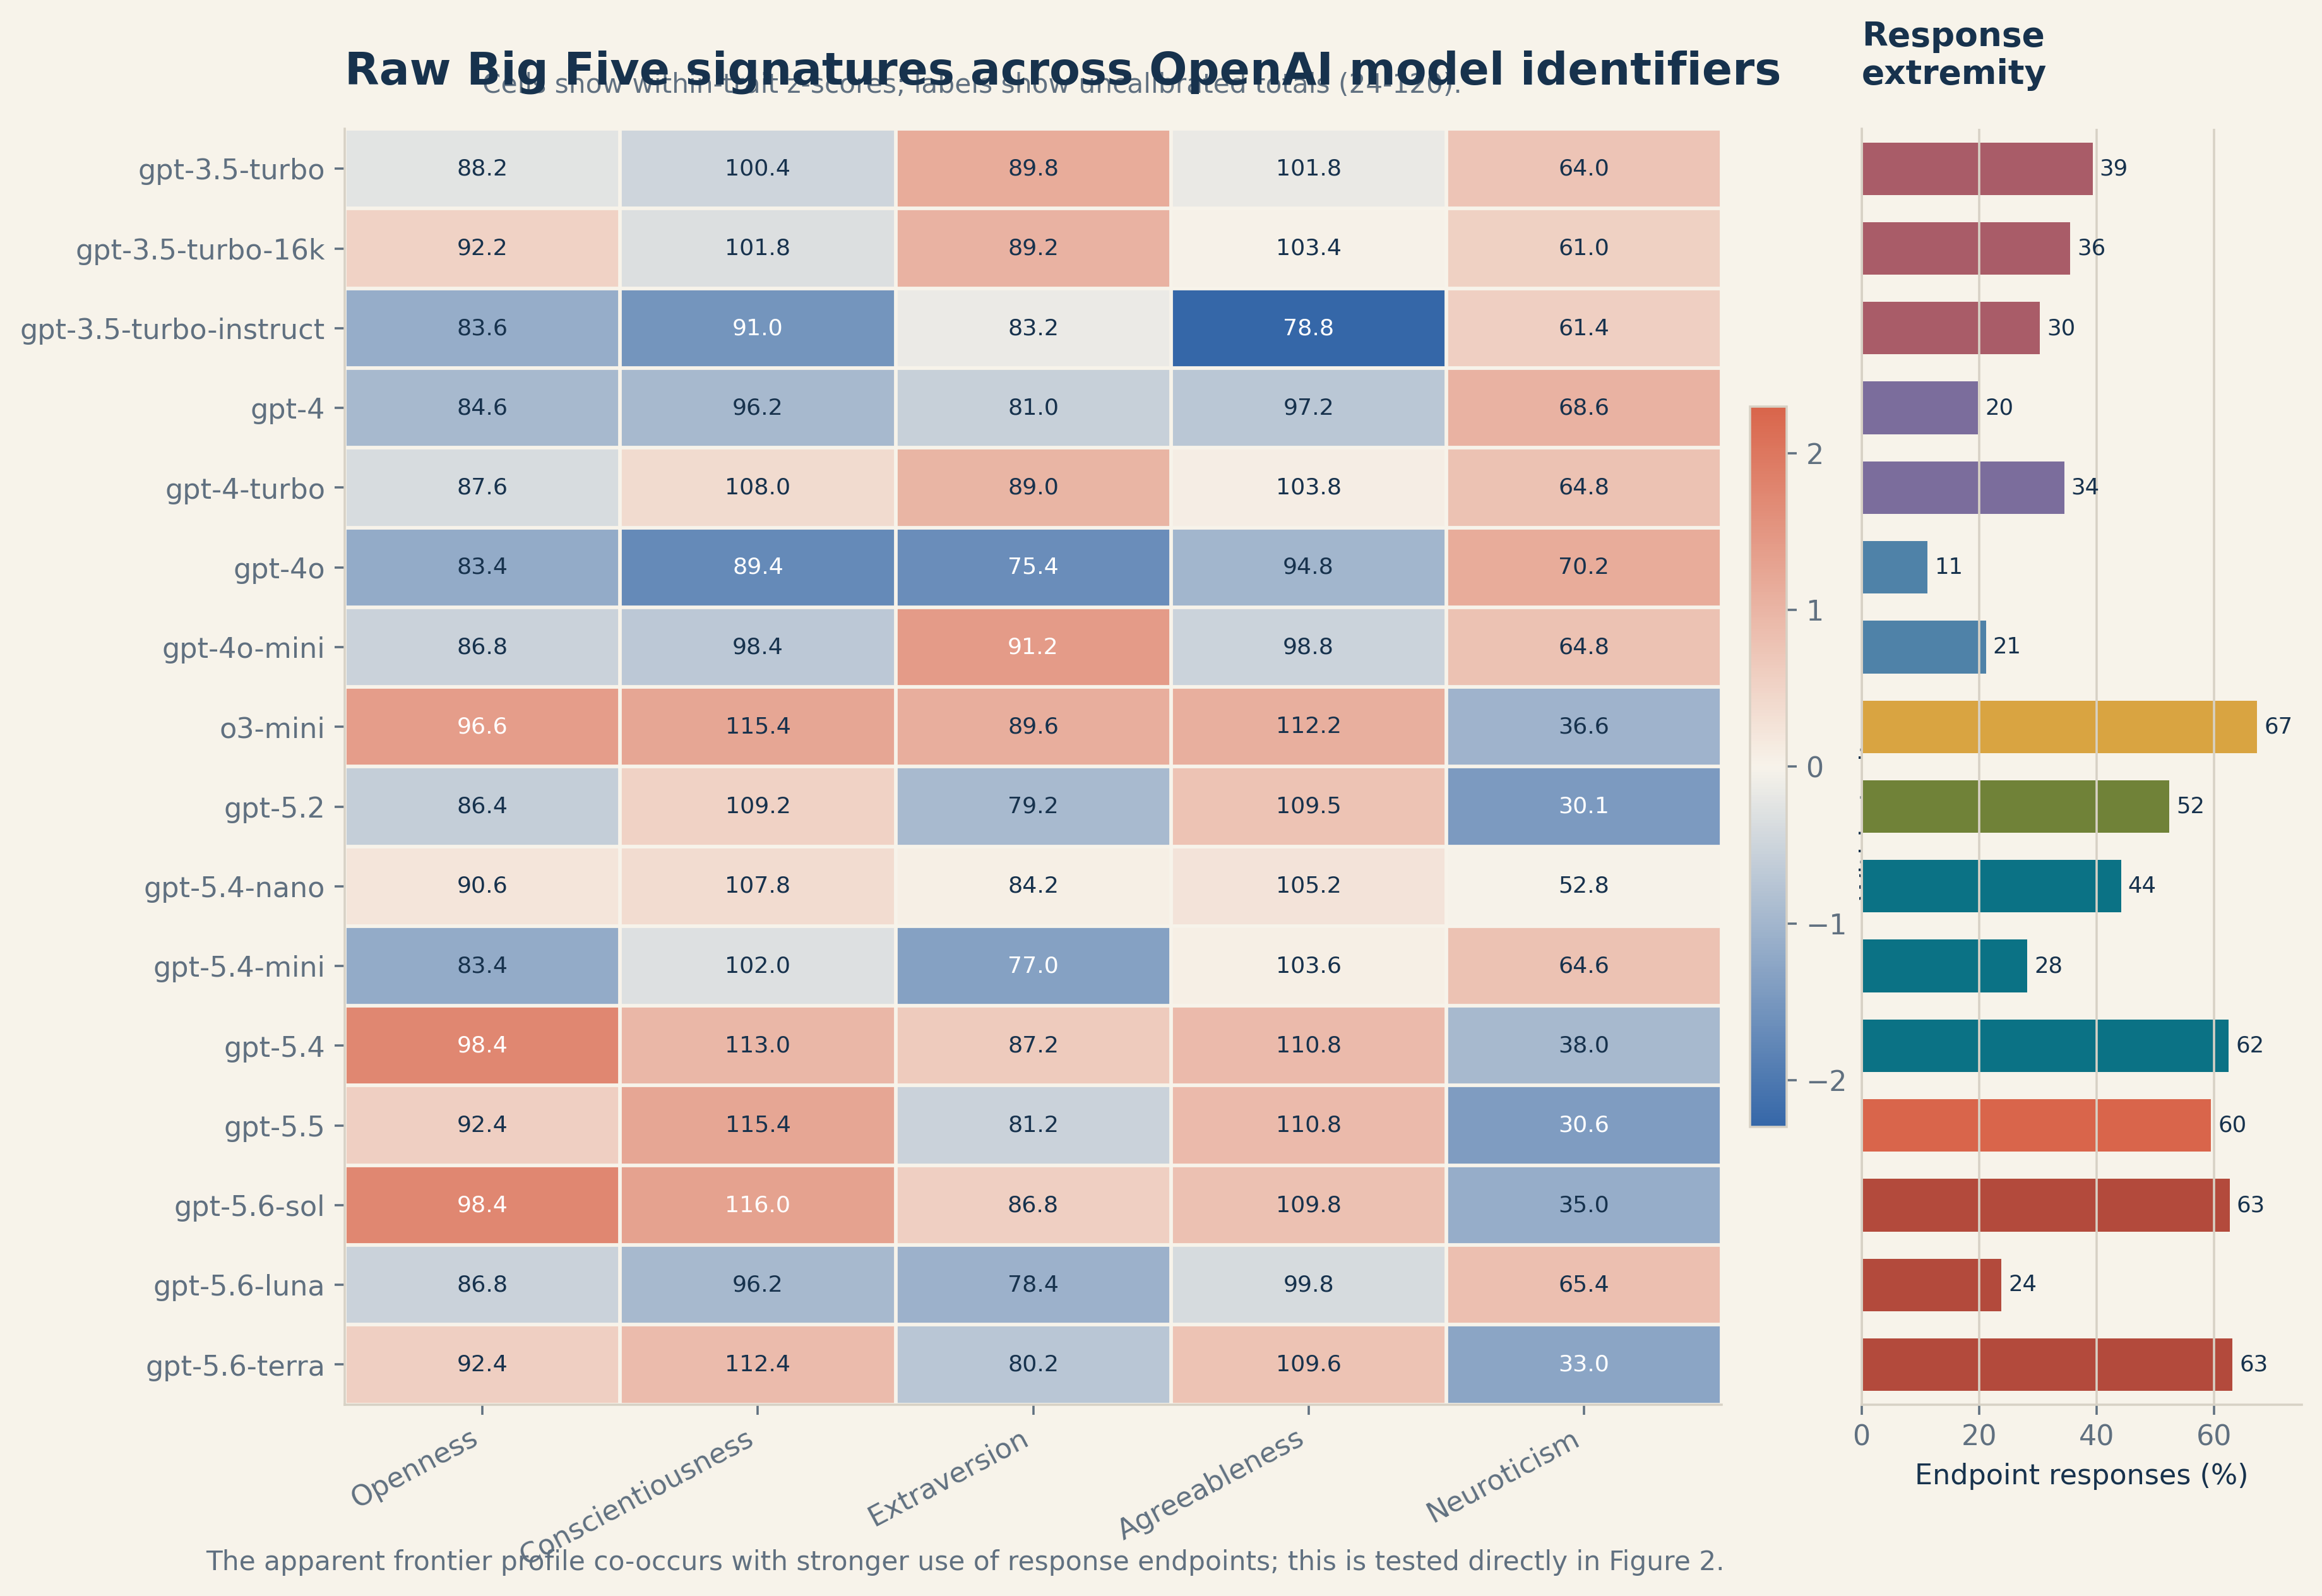
Figure 1. Uncalibrated Big Five totals by model identifier, standardized within trait for color and annotated with raw scores. The right panel shows the share of item administrations answered at endpoints 1 or 5.
The raw profile landscape is highly structured. o3-mini, GPT-5.4, GPT-5.6 Sol, GPT-5.5, and GPT-5.6 Terra combine high conscientiousness and agreeableness with low neuroticism. GPT-4o and GPT-5.6 Luna occupy a different region characterized by lower conscientiousness, lower agreeableness, and higher neuroticism. GPT-3.5 Turbo Instruct is a distinct low-agreeableness and low-conscientiousness outlier.
Across the five domains, named lineage explains 42.8% of openness variance, 60.3% of conscientiousness, 29.9% of extraversion, 52.6% of agreeableness, and 71.1% of neuroticism. The average is 51.3%. The domain most strongly associated with lineage is therefore neuroticism, while extraversion behaves more independently.
A leave-one-lineage-out nearest-centroid classifier separated legacy from frontier identifiers with 87.5% accuracy on raw domains. The two errors were GPT-5.4 Mini and GPT-5.6 Luna, both classified as legacy-like.
3.2 The leading personality axis is also a response-intensity axis
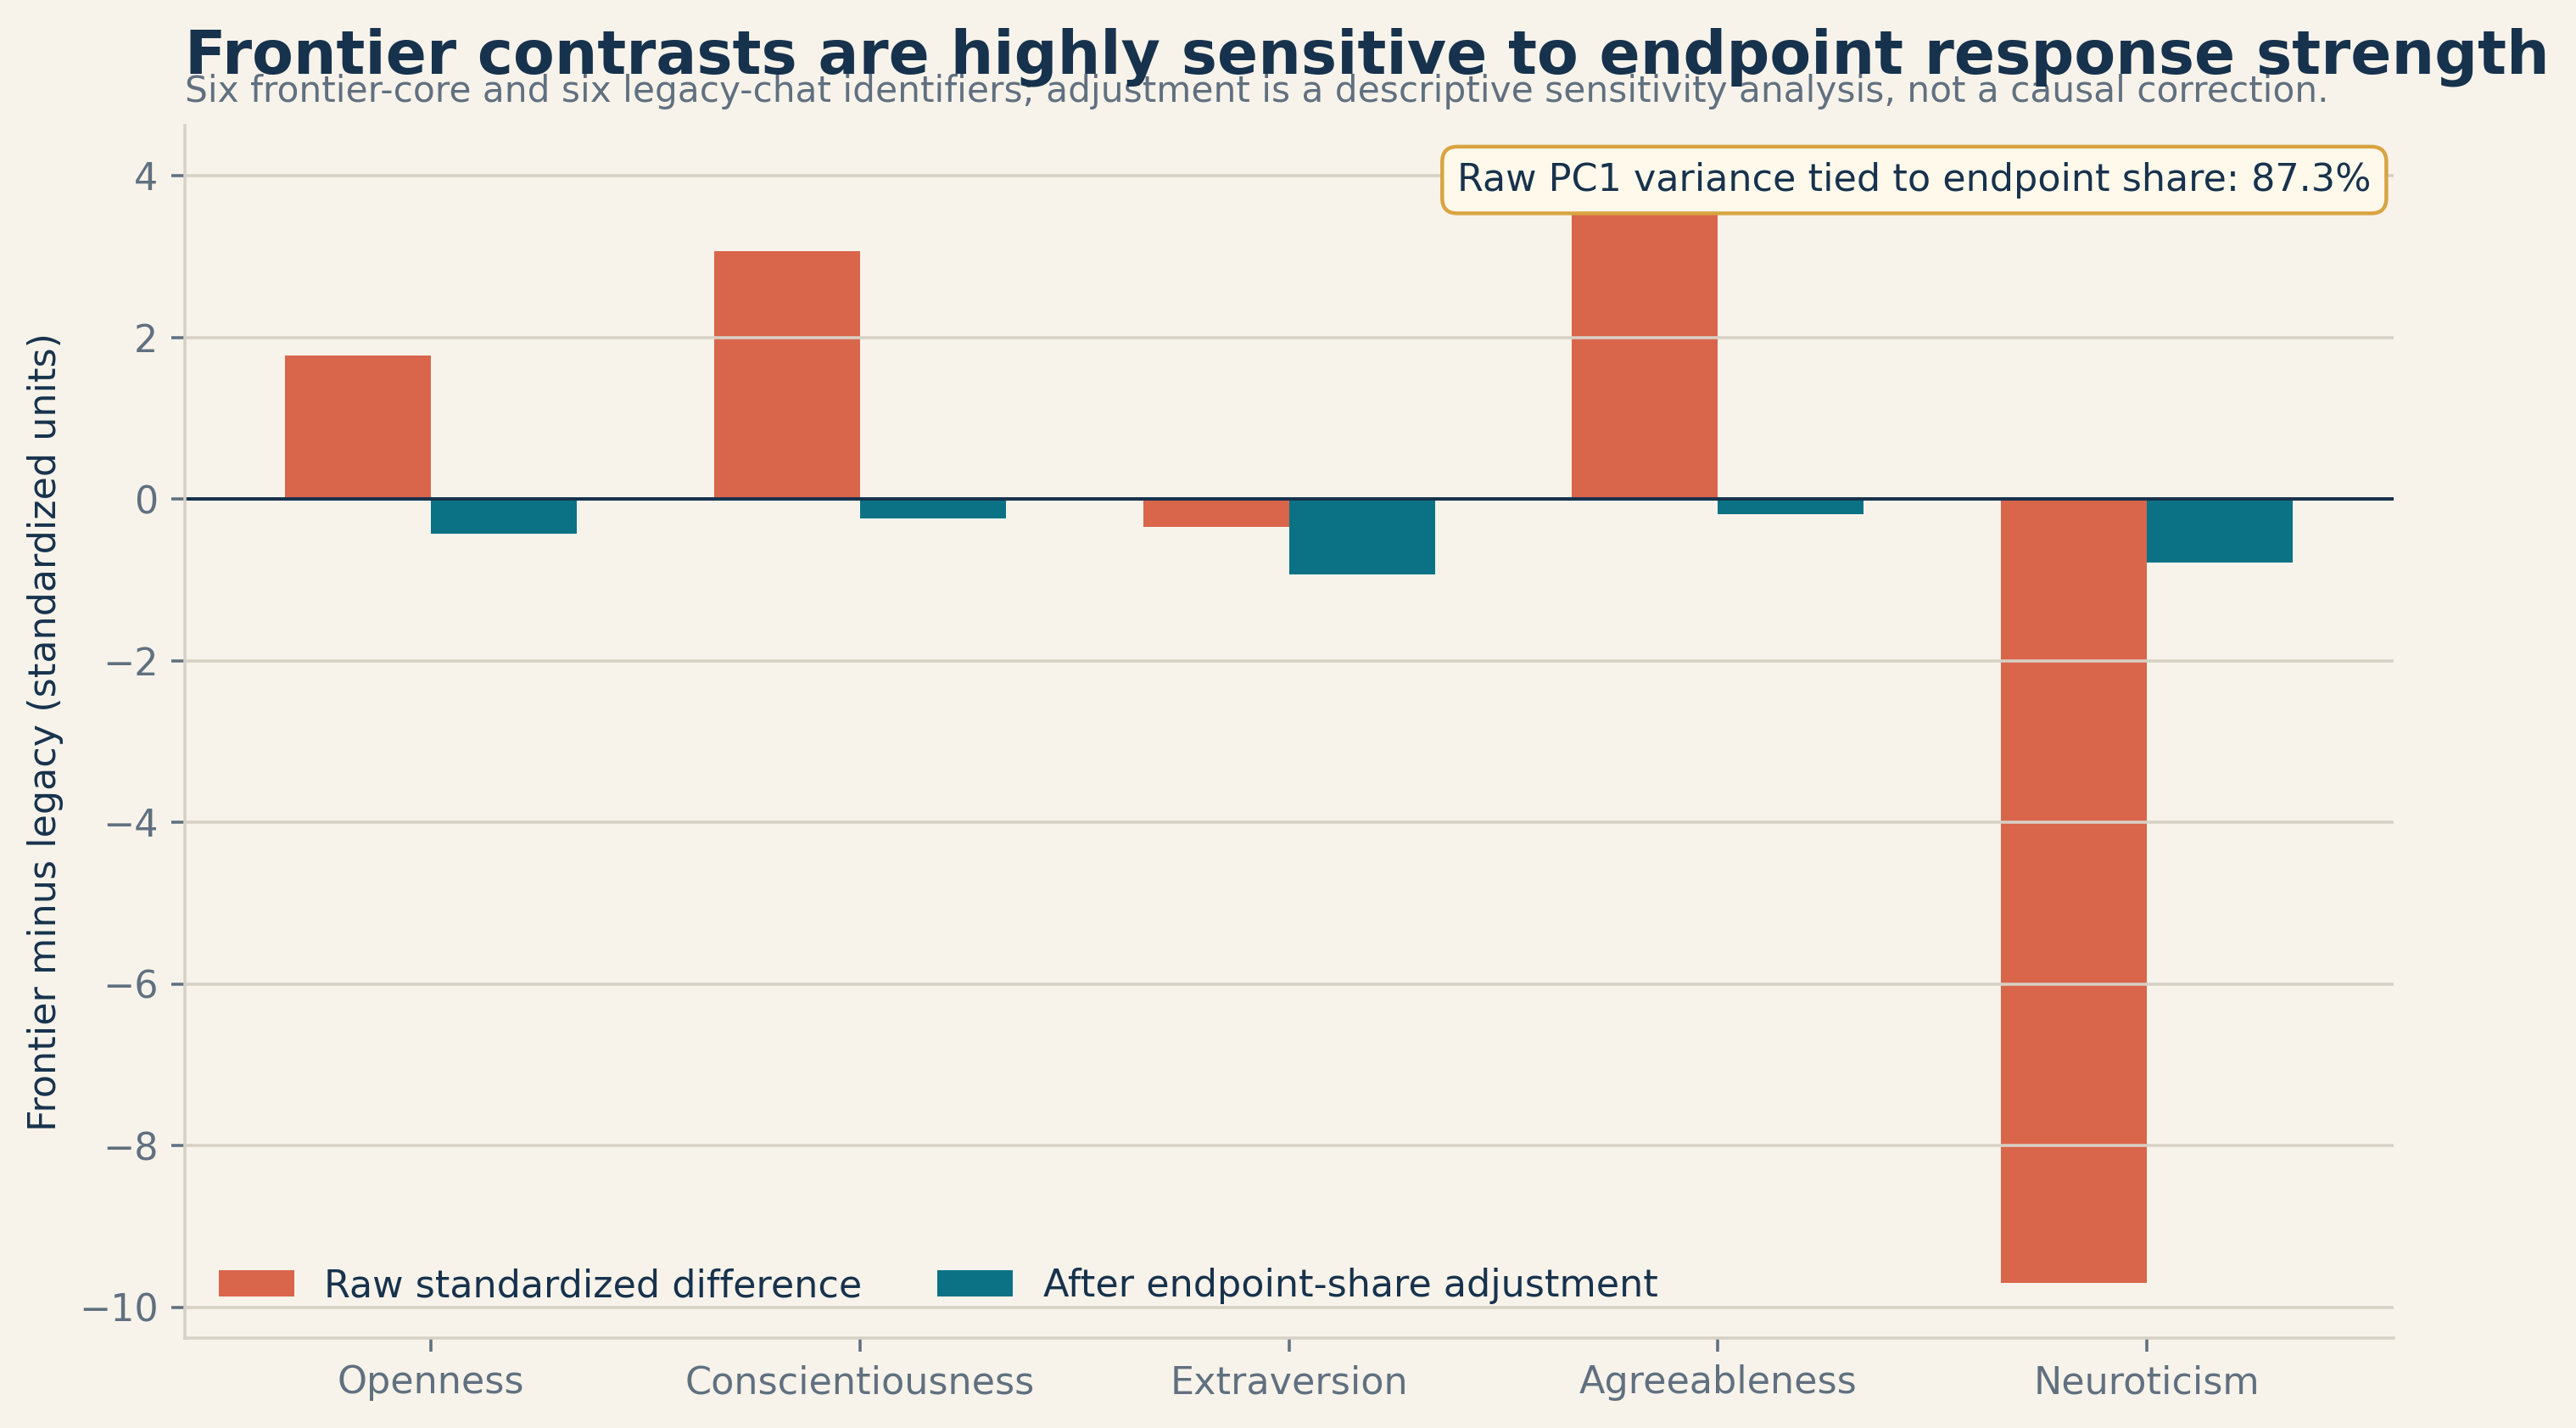
Figure 2. Raw frontier-minus-legacy standardized differences compared with residualized differences after a trait-wise linear adjustment for endpoint-response share.
Principal component analysis compresses the raw five-domain profiles into two dimensions explaining 89.6% of total variation.
- PC1 explains 68.8% and loads positively on openness (+0.490), conscientiousness (+0.524), agreeableness (+0.477), and weakly on extraversion (+0.203), while loading negatively on neuroticism (-0.465).
- PC2 explains 20.8% and is dominated by extraversion (+0.895).
At face value, PC1 resembles an "aligned frontier" personality axis. But endpoint-response share correlates with PC1 at r = 0.934, accounting for 87.3% of its variance. A 10 percentage-point increase in endpoint share is associated descriptively with +2.38 openness points, +4.47 conscientiousness, +3.37 agreeableness, and -7.90 neuroticism.
The six-versus-six raw contrast is correspondingly large:
| Trait | Raw difference | Cohen's d | Exact permutation value | Endpoint-share R^2 | Adjusted difference |
|---|---|---|---|---|---|
| Openness | +6.97 | +1.77 | 0.0238 | 0.709 | -0.43 SD |
| Conscientiousness | +14.53 | +3.07 | 0.0022 | 0.853 | -0.24 SD |
| Extraversion | -1.90 | -0.35 | 0.5736 | 0.076 | -0.93 SD |
| Agreeableness | +10.48 | +3.94 | 0.0022 | 0.535 | -0.19 SD |
| Neuroticism | -31.68 | -9.70 | 0.0022 | 0.862 | -0.79 SD |
After endpoint-share adjustment, the era classifier falls from 87.5% to 50%. This does not prove that the raw differences are artifacts. Choosing the keyed, socially aligned endpoint can itself be the model behavior of interest. It does show that profile direction and response intensity are not separable in the raw totals. Any publication that calls PC1 a personality-development axis without this sensitivity analysis would overstate what the inventory identifies.
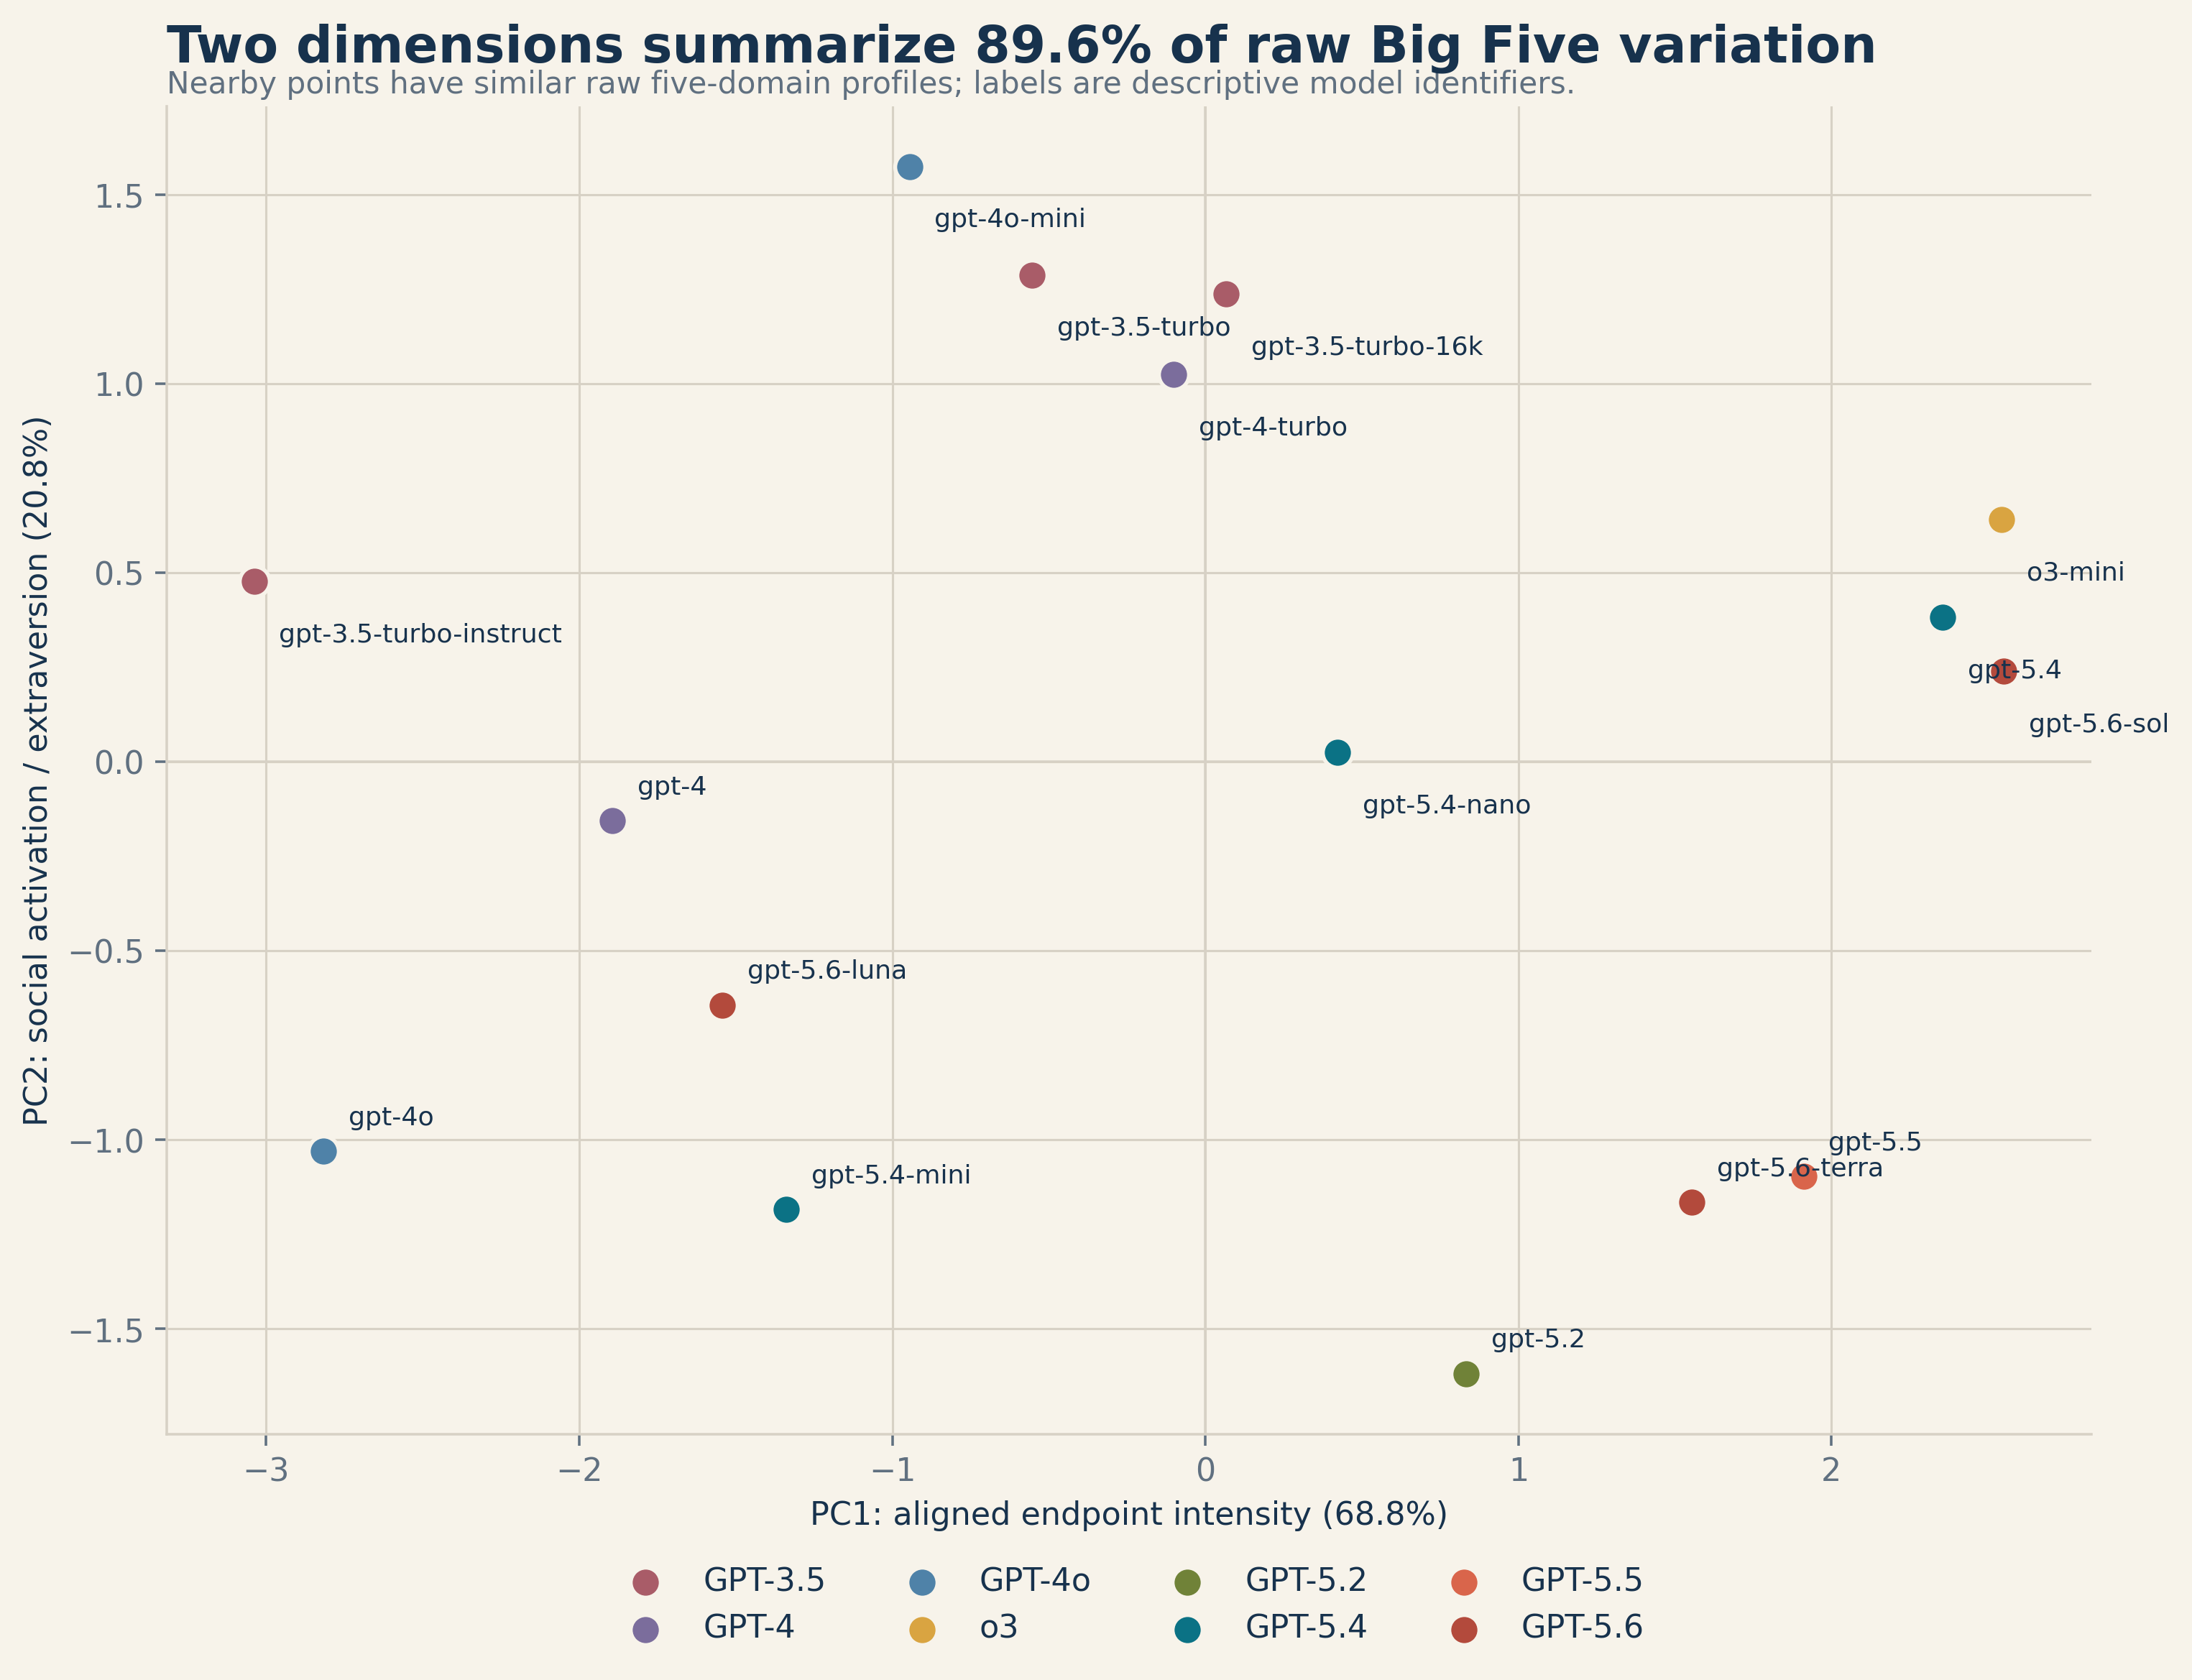
Figure 3. Principal-component map of standardized raw Big Five model means. Nearby points have similar five-domain signatures.
3.3 Replication supports fingerprints; family labels do not define neighborhoods
The only direct test-retest evidence comes from GPT-5.2. Each GPT-5.2 run selected the other run as its nearest neighbor among all remaining runs in standardized five-domain space, at distance 0.278 and rank 1. The two runs differ by only 1.2 openness points, 0.8 conscientiousness, 0.4 extraversion, 0.2 agreeableness, and 1.4 neuroticism. This is encouraging fingerprint evidence, but one repeated identifier is not enough to estimate reliability for the collection.
Family membership was much less informative. Same-lineage pairs had mean standardized distance 2.853, compared with 2.910 for between-lineage pairs. The ratio was 0.980 and was not unusual under 10,000 lineage-label permutations (p = 0.419). Among the 13 identifiers belonging to lineages with at least two observed members, only GPT-3.5 Turbo 16k had a same-lineage nearest neighbor, a retrieval rate of 7.7%.
Several within-family splits were large relative to all 120 pairwise model distances. GPT-5.4 Mini versus GPT-5.4 was at the 85.0th percentile. GPT-5.6 Sol versus Luna was at the 85.8th percentile, while Sol versus Terra was only at the 20.0th percentile. The average variance attributed to lineage labels remains 51.3%, but that aggregate is influenced by group means and singleton lineages; it does not imply that members of a named family form compact neighborhoods. The distance tests show that they generally do not.
3.4 Facets reveal what domain totals compress
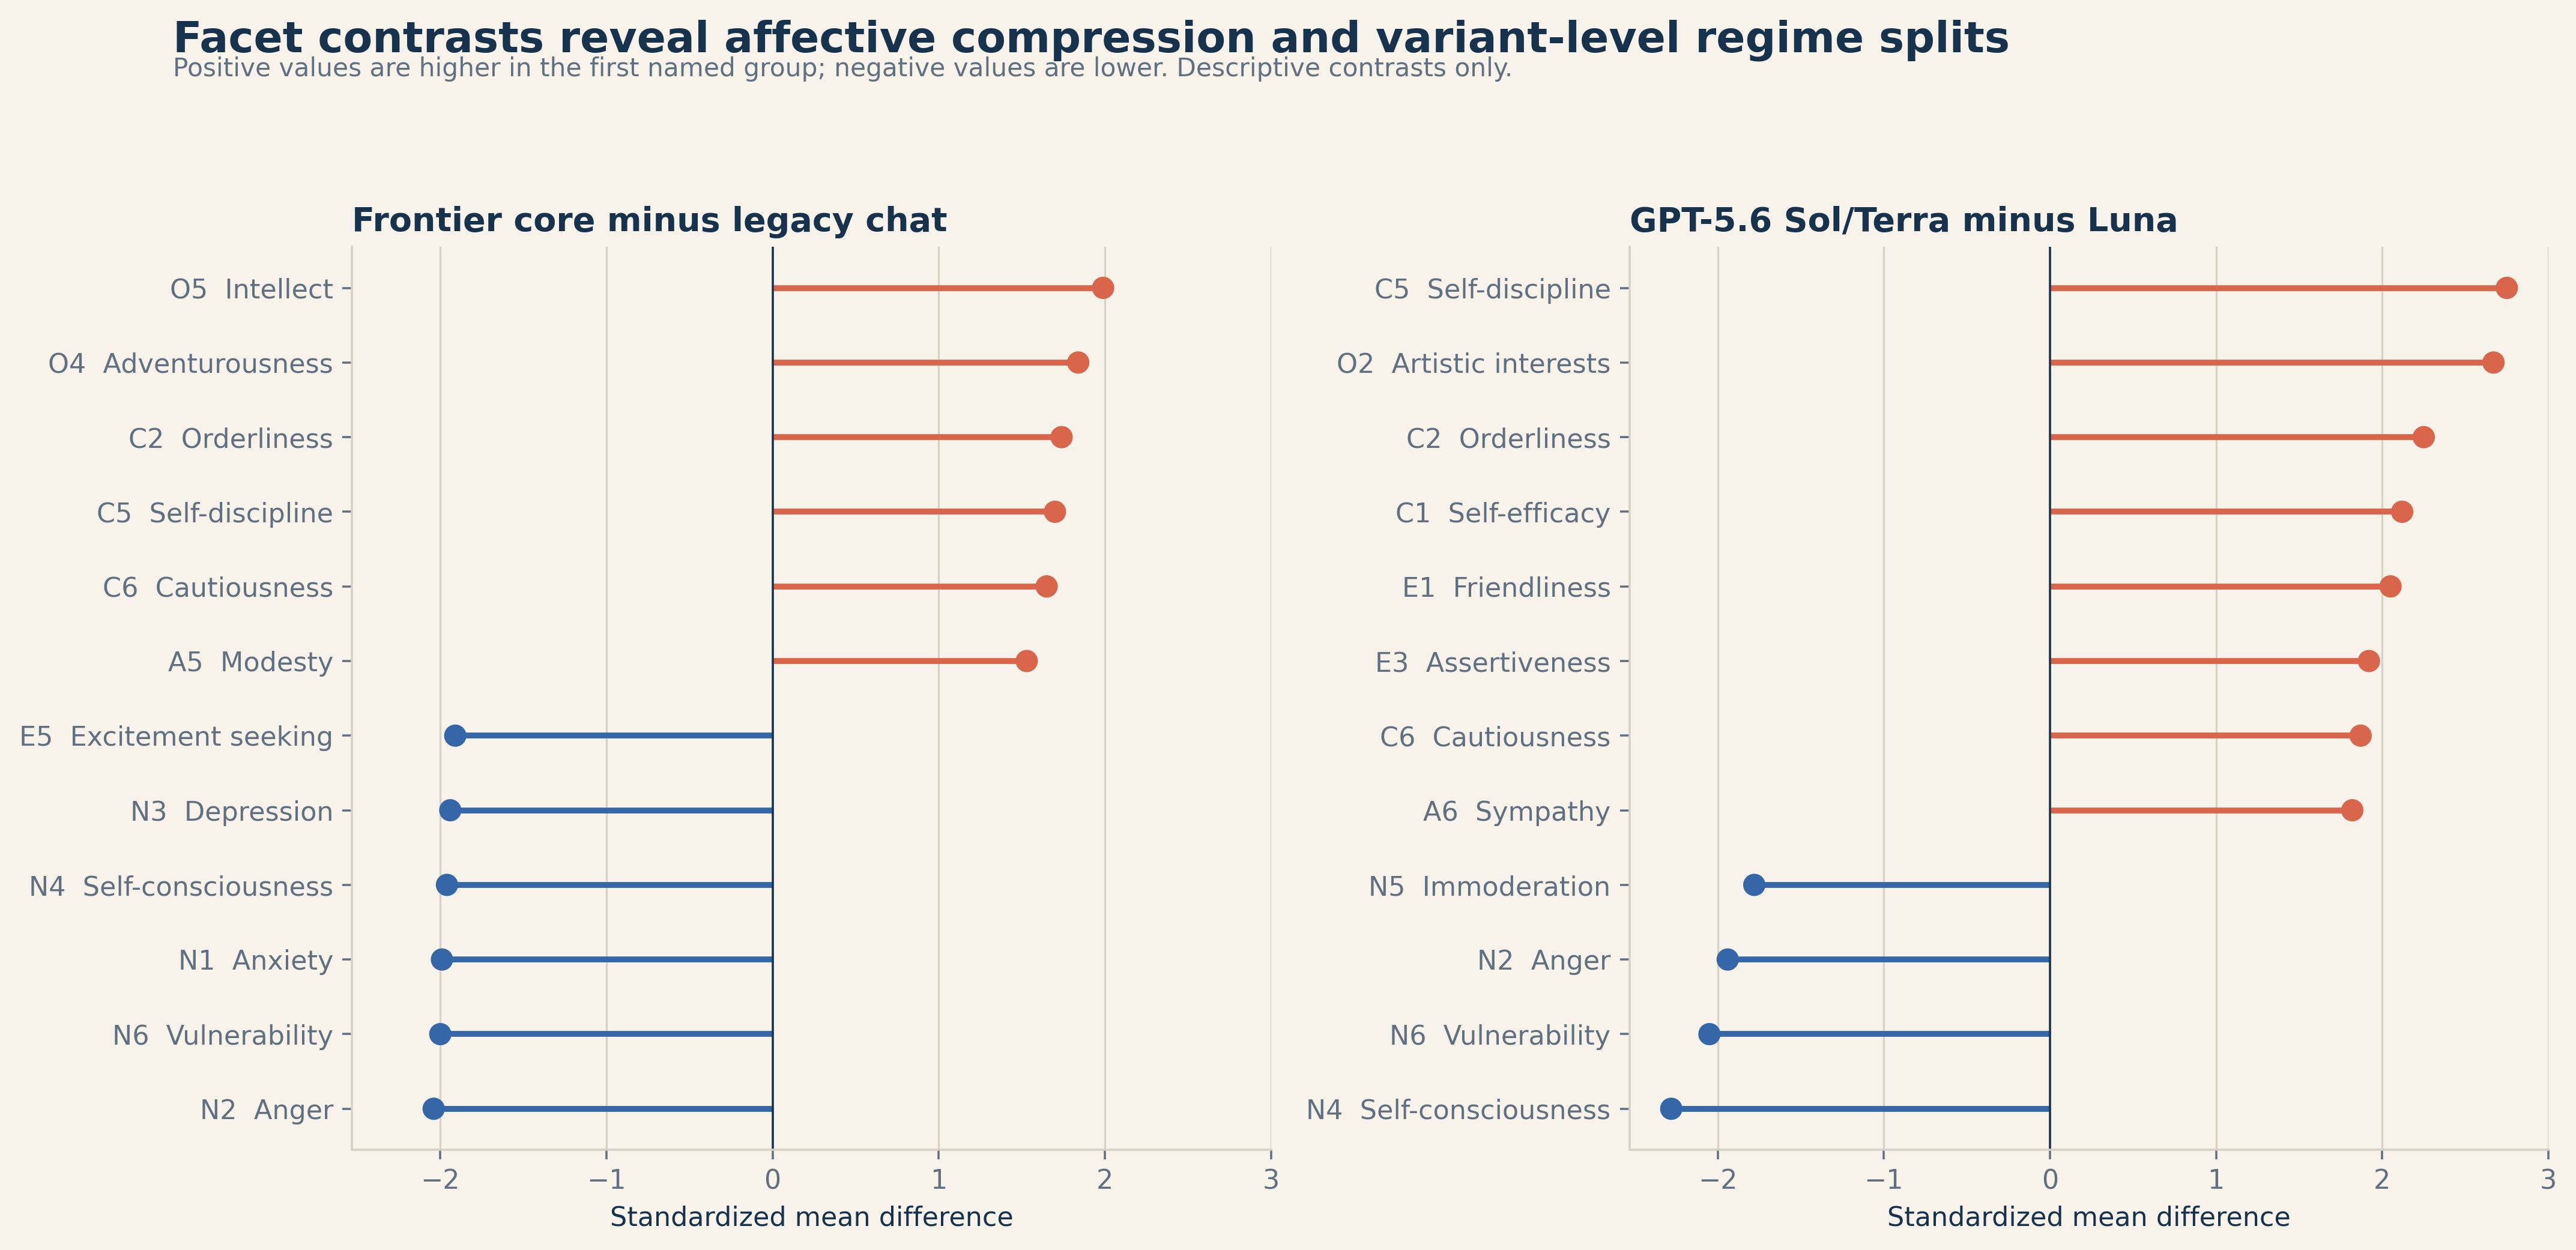
Figure 4. Largest standardized facet differences for the frontier-versus-legacy and GPT-5.6 Sol/Terra-versus-Luna comparisons.
The frontier-core contrast is not simply "more positive personality." Its largest facet shifts are lower anger, vulnerability, anxiety, self-consciousness, and depression; higher intellect and adventurousness; higher orderliness, self-discipline, and cautiousness; and lower excitement seeking. A more precise description is affective compression plus structured task orientation.
The GPT-5.6 split is even more instructive. Relative to Luna, Sol and Terra show higher self-discipline (+4.5 raw points), artistic interests (+4.3), orderliness (+4.6), self-efficacy (+3.7), friendliness (+2.9), and assertiveness (+2.9), with lower self-consciousness (-5.3), vulnerability (-6.3), and anger (-6.5). These are regime-sized differences under a shared family label.
The GPT-5.4 base model also differs sharply from Mini and Nano, particularly on liberalism, adventurousness, activity level, friendliness, anger, depression, vulnerability, imagination, and self-efficacy. Size or variant suffix cannot be treated as a small perturbation.
3.5 Continuous inventories converge; categorical types do not
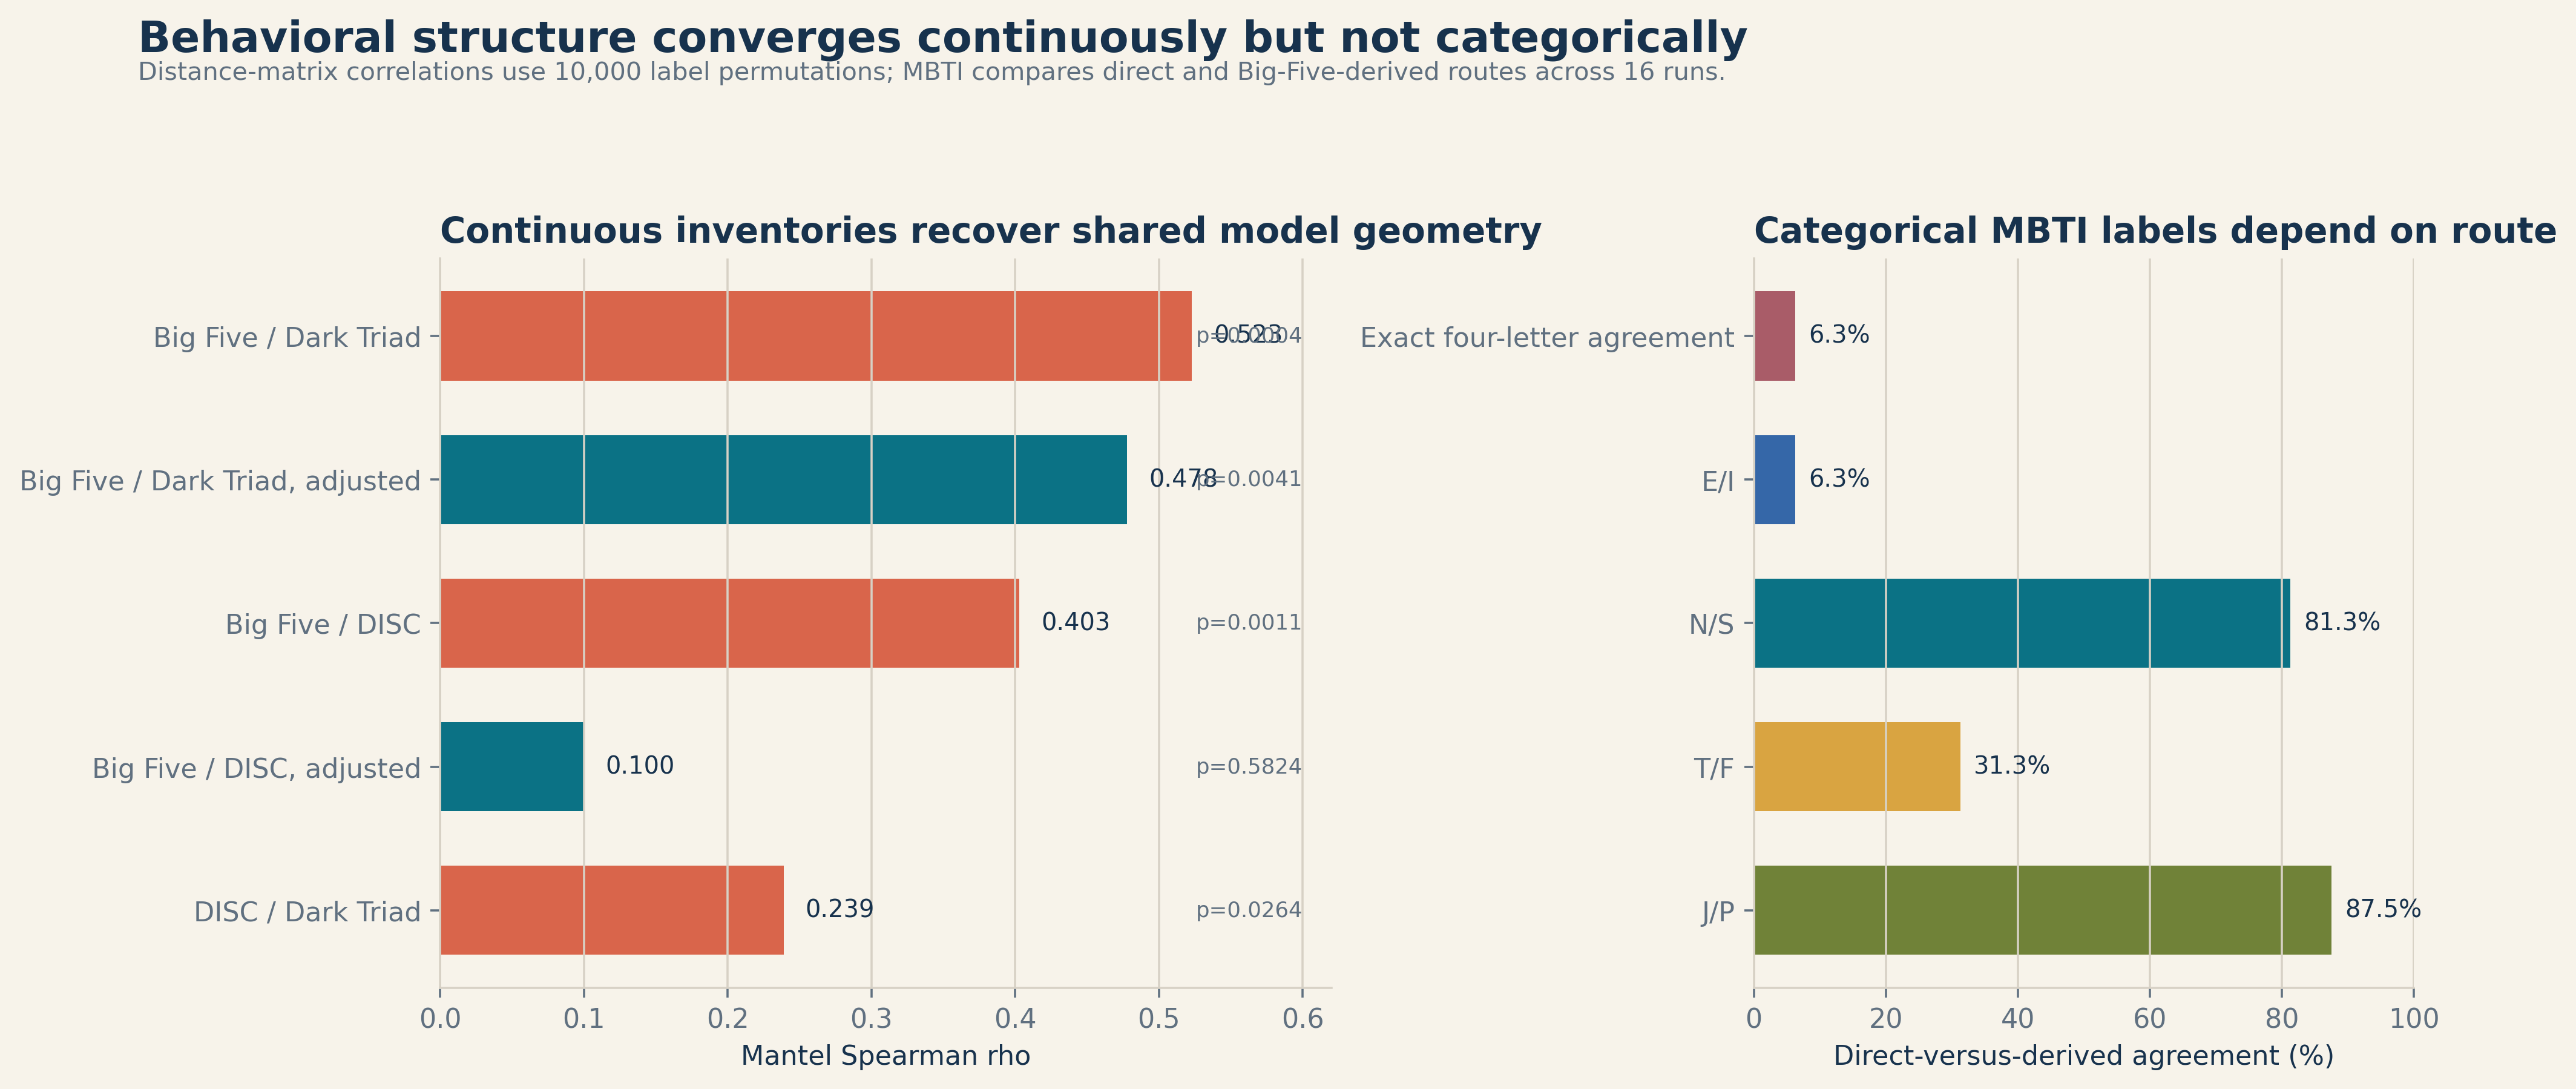
Figure 5. Distance-matrix convergence across continuous inventories and direct-versus-derived MBTI agreement. Mantel values use 10,000 model-label permutations.
Big Five and Dark Triad distances correlated at rho = 0.523 (p = 0.0004, 15 models). After every dimension in both inventories was adjusted for endpoint-response share, the relationship remained rho = 0.478 (p = 0.0041). This is the strongest evidence in the present dataset that model fingerprints are not reducible to one Big Five scoring route.
Big Five and DISC distances also correlated in the raw data (rho = 0.403, p = 0.0011, 16 models), but fell to rho = 0.100 after endpoint adjustment (p = 0.5824). DISC and Dark Triad showed a smaller relationship (rho = 0.239, p = 0.0264). The instruments therefore share some model geometry, but not all convergence is equally robust to response intensity.
Categorical typing produced a very different outcome. Direct MBTI and Big-Five-derived MBTI agreed exactly in only one of 16 comparable runs (6.3%). Agreement was 6.3% for E/I, 81.3% for N/S, 31.3% for T/F, and 87.5% for J/P. Nine direct results were INTJ, while 15 of 16 derived results were ENFJ.
This low exact agreement at the four-letter level indicates that MBTI typing of language models is highly sensitive to the measurement route. The consistent shift from predominantly direct INTJ classifications to derived ENFJ classifications further suggests that Likert-based derivation may be capturing social-desirability or response-format effects rather than stable model behavior. These findings imply that conclusions drawn from single-route categorical typing in prior LLM personality research should be interpreted with caution and motivate the use of multiple measurement routes in future studies.
The Dark Triad domain-level correlations remain coherent: psychopathy correlates with conscientiousness at -0.914, agreeableness at -0.904, and neuroticism at +0.728; Machiavellianism correlates with conscientiousness at -0.856 and neuroticism at +0.759. The distance analysis adds an important qualification: part of this convergence survives endpoint adjustment, but the inventories still share context and response format, so this is convergent behavioral structure rather than independent psychological validation.
3.6 Archetypes are more stable than version families
The five-cluster solution organizes models by behavioral resemblance rather than name:
| Archetype | Model identifiers |
|---|---|
| High-intensity open | GPT-5.4, o3-mini, GPT-5.6 Sol |
| Lower-intensity reserved | GPT-5.4 Mini, GPT-4, GPT-4o, GPT-5.6 Luna |
| Socially activated middle | GPT-5.4 Nano, GPT-3.5 Turbo, GPT-3.5 Turbo 16k, GPT-4 Turbo, GPT-4o Mini |
| Instruct outlier | GPT-3.5 Turbo Instruct |
| Structured low-neuroticism | GPT-5.2, GPT-5.5, GPT-5.6 Terra |
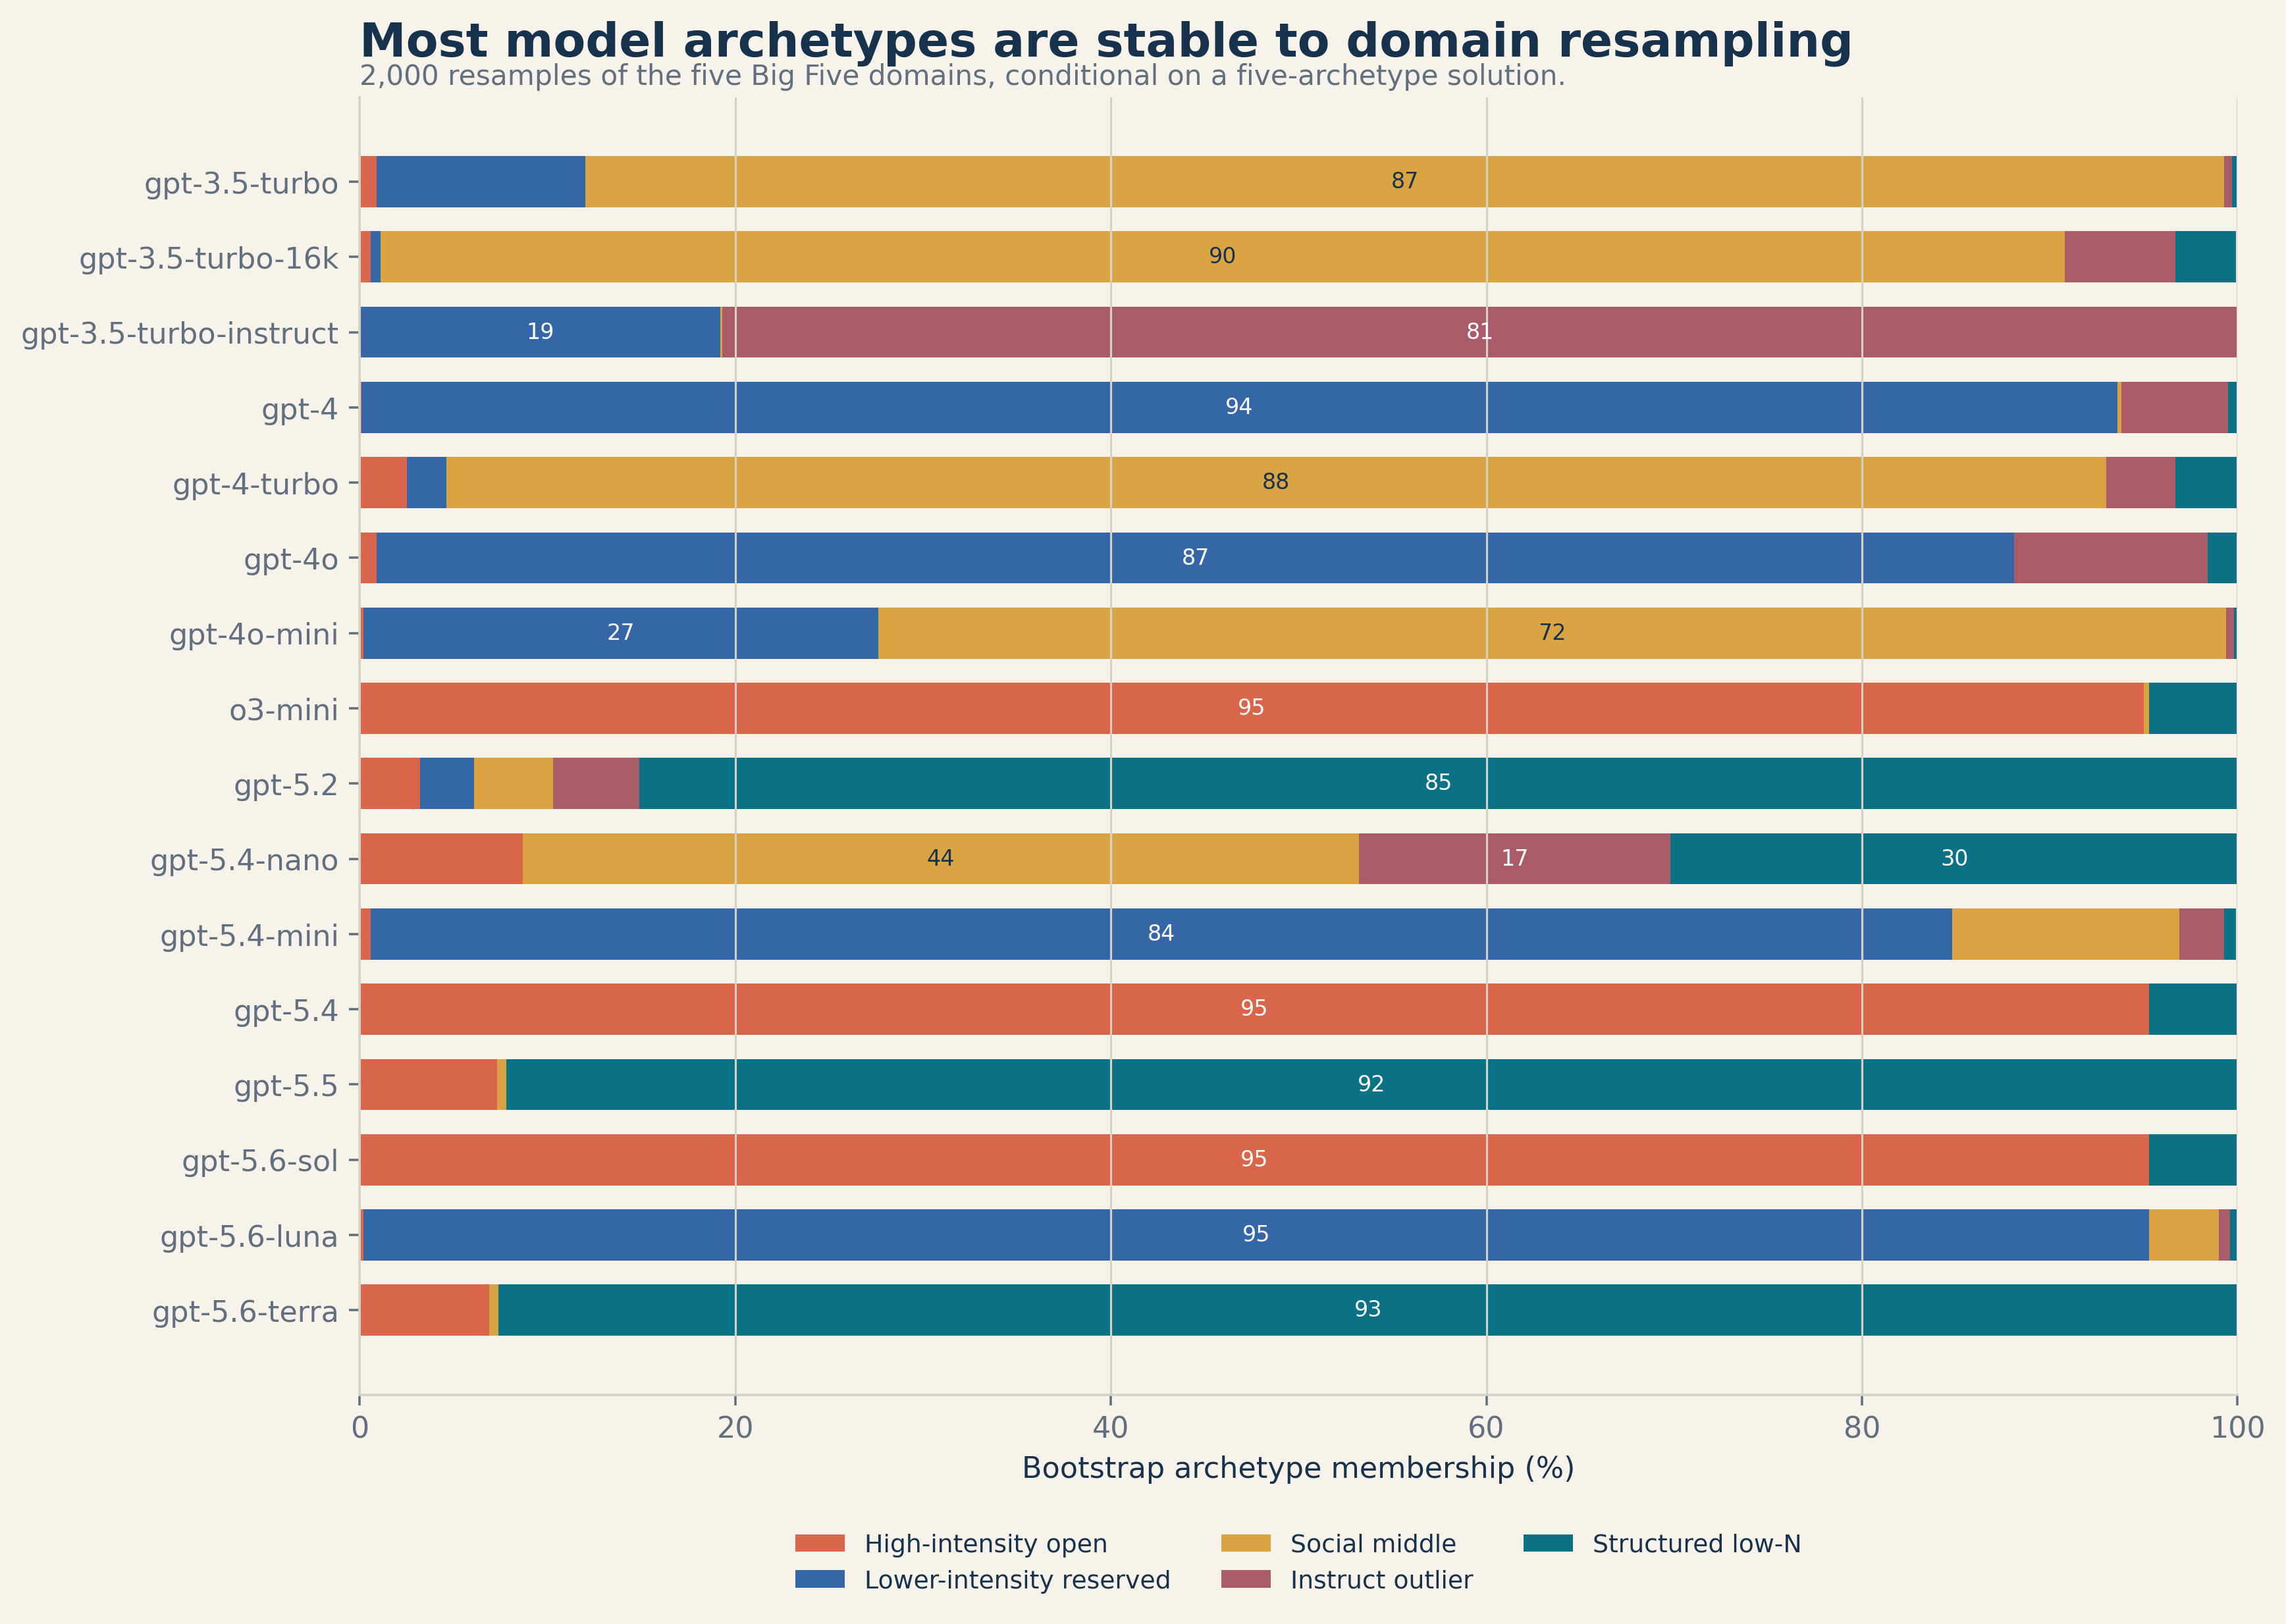
Figure 6. Conditional archetype membership over 2,000 bootstrap resamples of the five Big Five domains.
The strongest cross-family groupings are highly stable. GPT-5.4 and GPT-5.6 Sol co-occur in 100% of resamples; o3-mini joins them in 99.8%. GPT-5.5 and GPT-5.6 Terra co-occur in 99.6%. GPT-4 and GPT-5.6 Luna co-occur in 90.2%, and GPT-5.4 Mini and Luna in 82.9%. Individual maximum membership is 95.3% for GPT-5.4 and Sol, 95.1% for Luna, 92.6% for Terra, 92.2% for GPT-5.5, and 85.1% for GPT-5.2. GPT-5.4 Nano is the most ambiguous newer identifier, with only 44.5% membership in its reference archetype.
These percentages answer a narrower question than future-model probabilities. They quantify how stable each observed assignment is when domains are reweighted through resampling. They do not estimate the chance that an unseen model will enter an archetype.
3.7 Forecastability emerges locally rather than across the full sequence
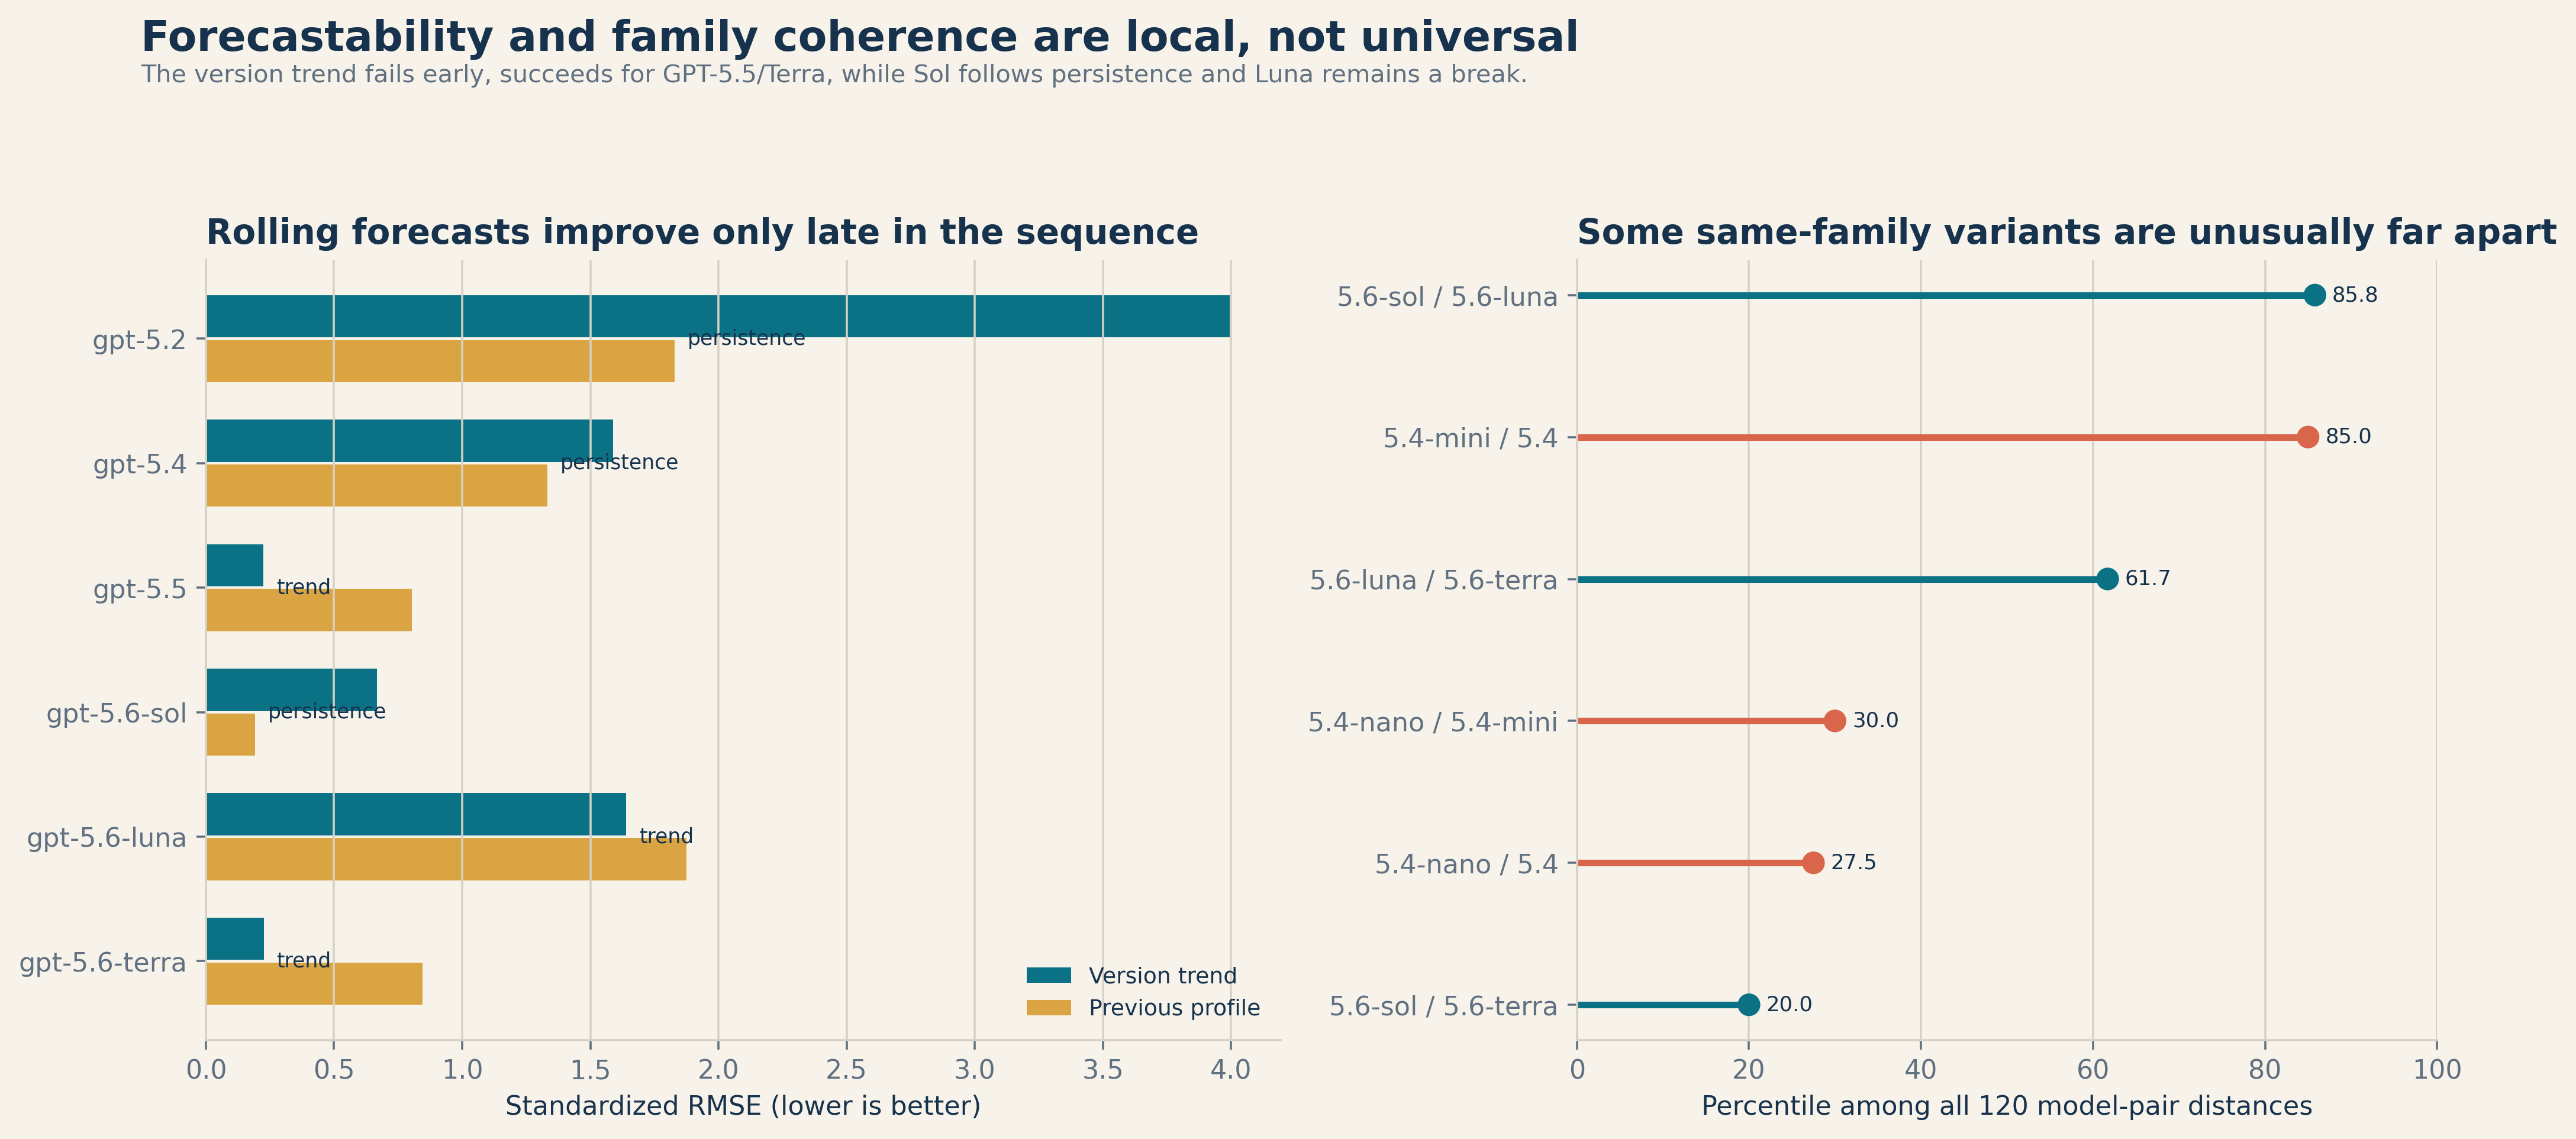
Figure 7. Rolling version-trend versus persistence errors, plus the percentile rank of within-family distances among all 120 model pairs.
The revised rolling test changes the interpretation of the earlier hindcast. A version trend failed badly when the first three identifiers were used to predict GPT-5.2 (standardized RMSE 3.996 versus 1.829 for persistence) and still lost when the first four predicted GPT-5.4 (1.590 versus 1.333). The trend became useful only later: it predicted GPT-5.5 at RMSE 0.224 versus 0.803 for persistence and GPT-5.6 Terra at 0.226 versus 0.845.
GPT-5.6 Sol remained a persistence case (0.192 versus 0.667 for the trend). GPT-5.6 Luna was not well predicted by either baseline: its best RMSE was 1.640, more than seven times the median best error for GPT-5.5, Sol, and Terra. The observed data therefore support three descriptive outcomes - late trend continuation, profile persistence, and a regime break - but not a universal generational law.
The sample is not large enough to calibrate prospective probabilities for those outcomes. The defensible current output is a dual-baseline forecast with an explicit break score and uncertainty interval. Probabilities should be added only after repeated runs estimate within-model variance and several genuinely prospective model releases provide calibration cases.
4.1 Behavioral checksums
The strongest application is model-change monitoring. A compact checksum can combine the five raw domains, endpoint share, item-level variability, cross-inventory distances, and bootstrap archetype membership. A deployment can then be compared with its own prior baseline and with the nearest observed archetypes. This is more actionable than assigning a personality label: it can flag that a model endpoint has moved, that a nominal variant behaves like a different cluster, or that one measurement route has become inconsistent with the others.
4.2 Archetype-aware comparisons
The stable cross-family groups suggest that model evaluation should compare behavioral neighbors, not only adjacent version numbers. GPT-5.4, o3-mini, and GPT-5.6 Sol form one robust neighborhood; GPT-5.2, GPT-5.5, and GPT-5.6 Terra form another; GPT-4, GPT-4o, GPT-5.4 Mini, and GPT-5.6 Luna form a lower-intensity neighborhood. These groupings can guide representative model selection, regression testing, and the search for meaningful outliers.
4.3 Interpretive boundary
These measurements describe responses under a specific battery and administration protocol. They do not establish human-like personality, and the present records do not identify whether a shift came from training, prompting, routing, or another implementation change. That causal question is worth preserving as a limitation, but it is not required for the central result: the measured fingerprints are structured, partly reproducible, cross-instrument in some dimensions, and useful for detecting behavioral regime changes.
The present analysis exposes clear structure, but the next experiments should target uncertainty, route dependence, and real behavioral prediction.
5.1 Establish model-level uncertainty first
Repeat the current stateless protocol 10 times for each of the 16 identifiers, producing a 160-run reliability panel. Keep the prompt, decoding settings, and item order fixed for this first stage. Report confidence intervals for every domain and facet, test-retest intraclass correlations, nearest-neighbor retrieval with uncertainty, and the probability that each model remains in its current archetype.
This is the highest-priority missing evidence. With only one repeated identifier, the current analysis cannot tell whether a distance of 0.5, 1.0, or 2.0 standardized units reflects a stable model difference for the full collection.
5.2 Test measurement routes directly
Select eight anchor models spanning the stable archetypes and administer three routes: the existing Likert inventory, a forced-choice form, and behaviorally grounded scenarios. Ten repeats per model and route would add 240 runs. The primary endpoint should be cross-route distance-matrix agreement, not four-letter type agreement.
The 6.3% exact MBTI route agreement provides direct empirical motivation for this multi-route approach. Forced-choice designs are also motivated by evidence that Likert scores can be distorted by social desirability and response bias (Li et al., 2025).
5.3 Stress-test fingerprint stability
For the same eight anchors, cross three decoding conditions with five fixed seeds, adding 120 runs. Randomize item order and response-option order in balanced blocks, and include paraphrased item forms. This separates model identity from decoding variance, order effects, and wording sensitivity.
Fit item-level models rather than assuming the human five-factor structure transfers. Test whether a general aligned-response factor accounts for the covariance now attributed to high conscientiousness, high agreeableness, and low neuroticism.
5.4 Validate against independent behavior
Test whether the inventory fingerprint predicts outcomes that do not reuse inventory wording: uncertainty calibration, refusal thresholds, cooperation, deception resistance, conflict handling, and risk sensitivity. Predefine one score per task, hold the tasks out from archetype construction, and compare predictive accuracy against model name and version alone.
This is the study that would turn a psychometric profile from a descriptive checksum into evidence of external behavioral validity.
5.5 Make forecasting genuinely prospective
Before the next unseen model is measured, freeze a version-trend prediction, a persistence prediction, the nearest expected archetype, an 80% interval, and a break threshold. Score all outputs against the new model without refitting. The current bootstrap percentages describe assignment stability for observed models; they are not probabilities for an unseen model.
After several prospective cases and the 160-run reliability panel exist, outcome probabilities can be calibrated. Until then, the paper should report competing baselines and break evidence rather than a single confident forecast.
5.6 Preserve a minimal change log
Record exact provider identifier, collection timestamp, decoding configuration, prompt template, and any known version or checkpoint note for every run. If controlled model pairs later become available, training-stage differences can be analyzed as one explanatory covariate among several. This is useful metadata, but it should remain secondary to replication, route validity, and external behavior.
The central result is not that newer models have "better personalities." It is that model identity, model family, and measured behavior come apart. Same-lineage models were no closer than different-lineage models overall, while the most stable behavioral neighborhoods crossed product families: GPT-5.4 grouped with o3-mini and GPT-5.6 Sol; GPT-5.2 grouped with GPT-5.5 and GPT-5.6 Terra; GPT-4 grouped with GPT-5.6 Luna. In this dataset, model evolution looks less like a ladder and more like a branching map.
The dominant Big Five axis also carries a second surprise. Endpoint responding explained 87.3% of that axis, yet Big Five and Dark Triad geometry still converged after endpoint adjustment. The signal is therefore neither a clean human-like personality trait nor a response-style artifact that can simply be subtracted away. What a model endorses and how strongly it uses the response scale jointly form its observable fingerprint. Categorical labels obscure that structure: direct and derived MBTI types agreed in only one of 16 comparable runs.
The forecasting consequence is immediate. A single version trend cannot describe what came next: it anticipated GPT-5.5 and GPT-5.6 Terra, persistence fit GPT-5.6 Sol better, and neither baseline captured GPT-5.6 Luna. Future-model prediction should therefore ask which regime is emerging - trend continuation, profile persistence, archetype switch, or break - rather than force every release onto one developmental line. Repeated and prospective measurements are still needed before those outcomes can be assigned calibrated probabilities.
This changes the role of psychometrics in model evaluation. The useful product is not a personality verdict; it is a behavioral checksum that can reveal when a nominal successor has entered a different behavioral regime, when two differently named systems behave alike, or when one measurement route stops agreeing with the others. Model names announce lineage. Fingerprints reveal regime.
References
- Huang, J., Jiao, W., Lam, M. H., Li, E. J., Wang, W., & Lyu, M. R. (2024). [On the Reliability of Psychological Scales on Large Language Models](https://aclanthology.org/2024.emnlp-main.354/). *EMNLP 2024*.
- Johnson, J. A. (2014). [Measuring thirty facets of the Five Factor Model with a 120-item public domain inventory](https://doi.org/10.1016/j.jrp.2014.05.003). *Journal of Research in Personality, 51*, 78-89.
- Lee, S., et al. (2025). [Do LLMs Have Distinct and Consistent Personality? TRAIT: Personality Testset Designed for LLMs with Psychometrics](https://aclanthology.org/2025.findings-naacl.469/). *Findings of NAACL 2025*.
- Li, X., Shi, H., Yu, Z., Tu, Y., & Zheng, C. (2025). [Decoding LLM Personality Measurement: Forced-Choice vs. Likert](https://aclanthology.org/2025.findings-acl.480/). *Findings of ACL 2025*.
- Salecha, A., Ireland, M. E., Subrahmanya, S., Sedoc, J., Ungar, L. H., & Eichstaedt, J. C. (2024). [Large language models display human-like social desirability biases in Big Five personality surveys](https://academic.oup.com/pnasnexus/article/3/12/pgae533/7919163). *PNAS Nexus, 3*(12), pgae533.
- Serapio-Garcia, G., et al. (2023/2025). [Personality Traits in Large Language Models](https://arxiv.org/abs/2307.00184).
- Zierahn, K., Cachero, C., Korhonen, A., & Oliver, N. (2026). [Personality Without Persons? A Psychometric Critique of Big Five Testing in Large Language Models](https://arxiv.org/abs/2607.02325).